Plot trajectories colored by velocity or relative stride length
Source:R/plot_velocity.R
plot_velocity.Rdplot_velocity() creates a plot of trajectories, colored by either velocity or relative stride length from track and track velocity R objects. The function uses ggplot2 package for visualization and allows customization of line width and color gradients.
Usage
plot_velocity(
  data,
  trackvel,
  type = NULL,
  param = NULL,
  lwd = NULL,
  colours = NULL,
  legend = NULL
)
Arguments
- data
A
trackR object, which is a list consisting of two elements:Trajectories: A list of interpolated trajectories, where each trajectory is a series of midpoints between consecutive footprints.Footprints: A list of data frames containing footprint coordinates, metadata (e.g., image reference, ID), and a marker indicating whether the footprint is actual or inferred.
- trackvel
A
track velocityR object consisting of a list where each element corresponds to a track and contains velocity or relative stride length data.- type
A character string specifying the type of plot. Options are:
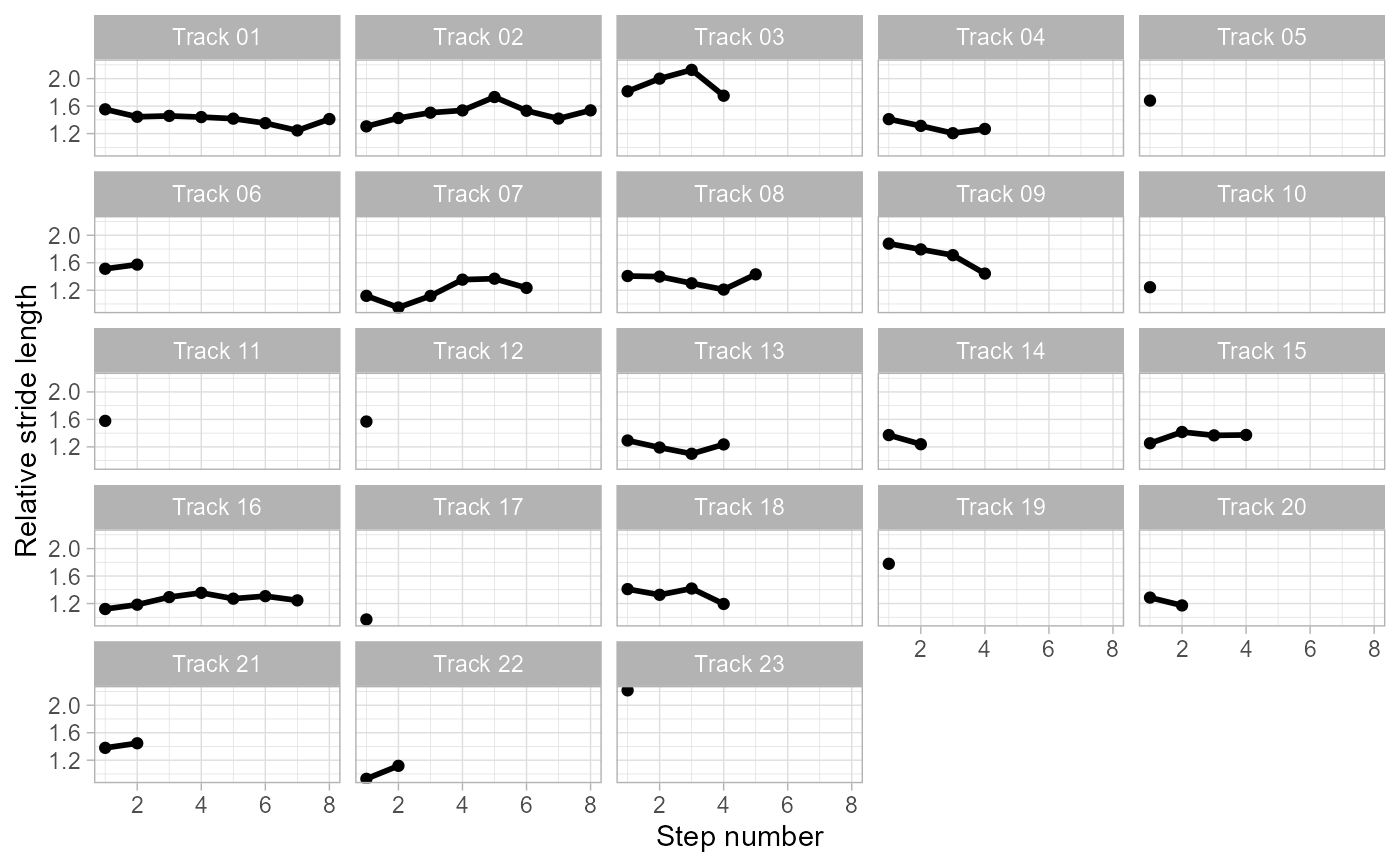
"tracksite"to plot the parameter on the trajectories (default)."sequence"to plot the parameter along the step sequence (x = step number, y = velocity or relative stride length) for each trackway. IfNULL, the default value"tracksite"will be used.
- param
A character string specifying the parameter to plot. Options are:
"V"for velocity."RSL"for relative stride length. IfNULL, the default value"V"will be used.
- lwd
Numeric. Line width for the plotted trajectories. Default is
1.- colours
A vector of colors to use for the gradient. Default is a predefined set of colors.
- legend
Logical. If
TRUE, the legend will be shown. IfFALSE, the legend will be removed. Default isTRUE.
Details
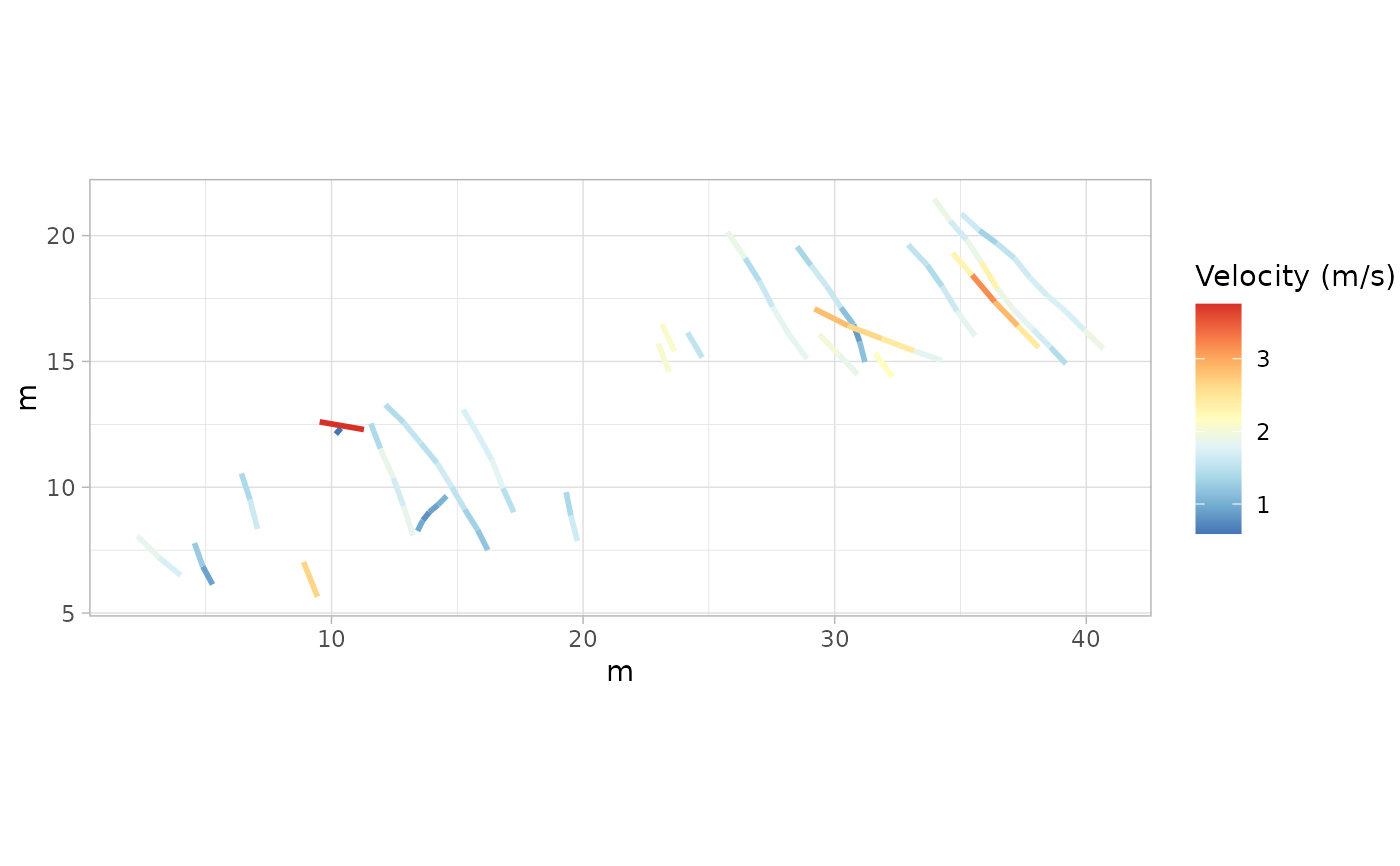
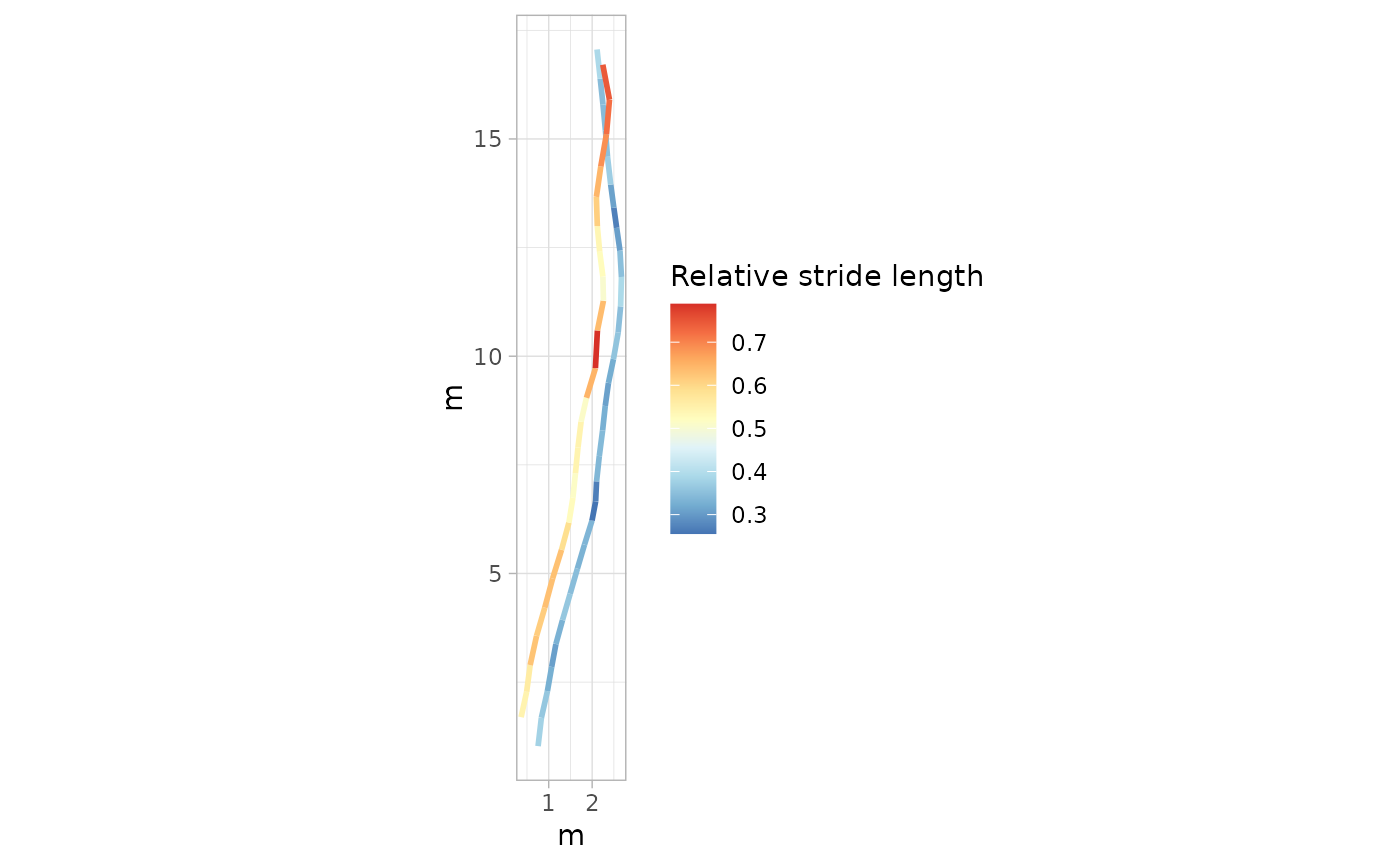
The function creates a plot where each trajectory is colored based on the specified parameter ("V" for velocity or "RSL" for relative stride length) when type = "tracksite".
When type = "sequence", the function creates a plot for each trackway showing the parameter along the step sequence.
The color gradient for the parameter is applied using scale_color_gradientn() when type = "tracksite". The color palette can be customized via the colours argument.
Author
Humberto G. Ferrón
humberto.ferron@uv.es
Macroevolution and Functional Morphology Research Group (www.macrofun.es)
Cavanilles Institute of Biodiversity and Evolutionary Biology
Calle Catedrático José Beltrán Martínez, nº 2
46980 Paterna - Valencia - Spain
Phone: +34 (9635) 44477
Examples
# Example 1: Plot Trajectories Colored by Velocity with Default Settings (MountTom dataset)
# Hip heights for each track in the MountTom dataset
H_mounttom <- c(
1.380, 1.404, 1.320, 1.736, 1.364, 1.432, 1.508, 1.768, 1.600, 1.848,
1.532, 1.532, 0.760, 1.532, 1.688, 1.620, 0.636, 1.784, 1.676, 1.872,
1.648, 1.760, 1.612
)
# Calculate velocities using the default Method "A"
V_mounttom <- velocity_track(MountTom, H = H_mounttom)
# Plot trajectories colored by velocity
plot1 <- plot_velocity(MountTom, V_mounttom, param = "V")
print(plot1)
 # Example 2: Plot Trajectories Colored by Relative Stride Length with Default Settings
# (PaluxyRiver dataset)
# Hip heights for each track in the PaluxyRiver dataset
H_paluxyriver <- c(3.472, 2.200)
# Specify different methods for different tracks
Method_paluxyriver <- c("A", "B")
# Calculate velocities using specified methods
V_paluxyriver <- velocity_track(PaluxyRiver, H = H_paluxyriver, method = Method_paluxyriver)
# Plot trajectories colored by relative stride length
plot2 <- plot_velocity(PaluxyRiver, V_paluxyriver, param = "RSL")
print(plot2)
# Example 2: Plot Trajectories Colored by Relative Stride Length with Default Settings
# (PaluxyRiver dataset)
# Hip heights for each track in the PaluxyRiver dataset
H_paluxyriver <- c(3.472, 2.200)
# Specify different methods for different tracks
Method_paluxyriver <- c("A", "B")
# Calculate velocities using specified methods
V_paluxyriver <- velocity_track(PaluxyRiver, H = H_paluxyriver, method = Method_paluxyriver)
# Plot trajectories colored by relative stride length
plot2 <- plot_velocity(PaluxyRiver, V_paluxyriver, param = "RSL")
print(plot2)
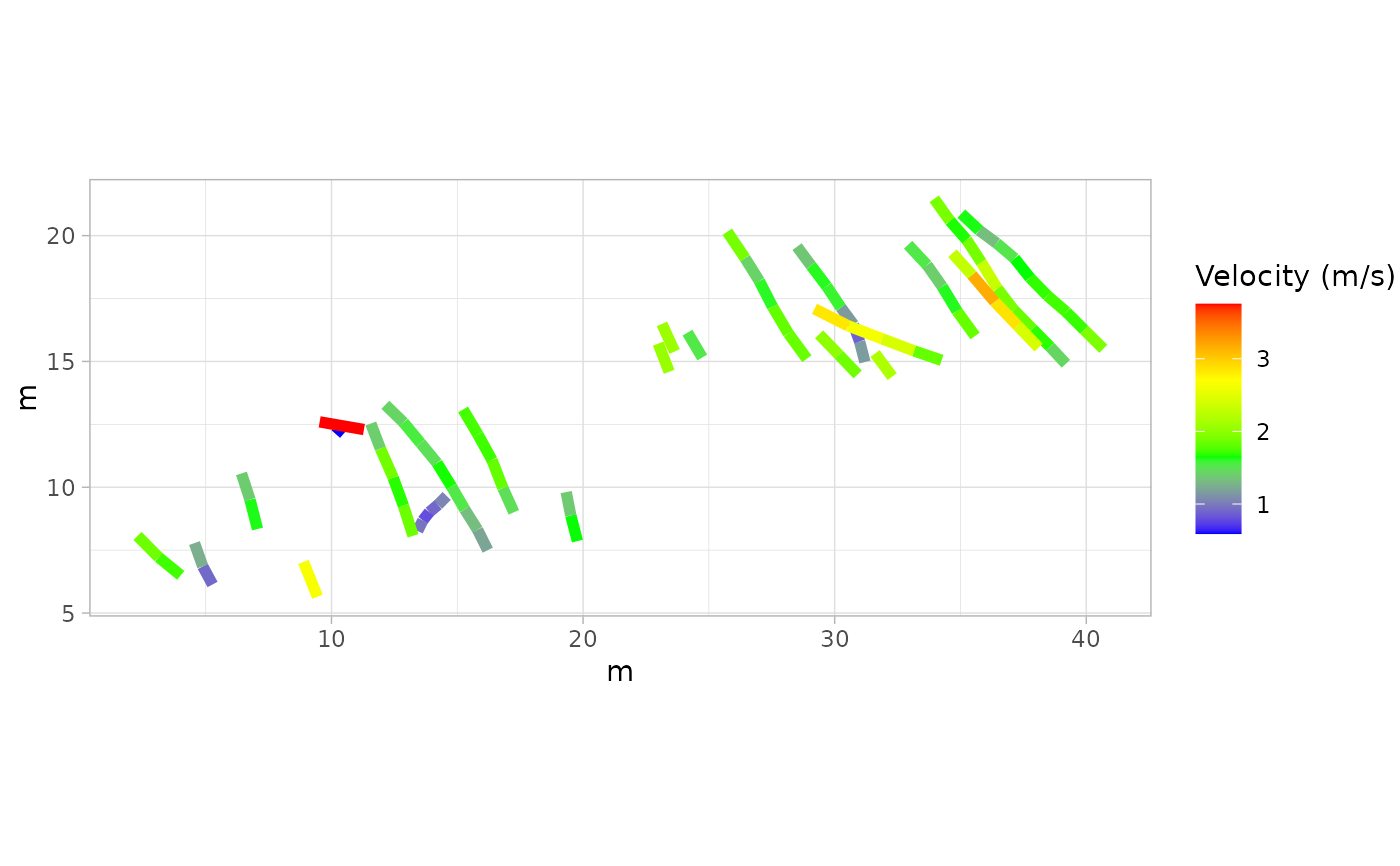
 # Example 3: Plot Trajectories Colored by Velocity with Custom Line Width and Colors
# (MountTom dataset)
# Custom colors and line width
custom_colours <- c("blue", "green", "yellow", "red")
custom_lwd <- 2
# Plot trajectories with custom colors and line width
plot3 <- plot_velocity(MountTom, V_mounttom,
param = "V", lwd = custom_lwd,
colours = custom_colours
)
print(plot3)
# Example 3: Plot Trajectories Colored by Velocity with Custom Line Width and Colors
# (MountTom dataset)
# Custom colors and line width
custom_colours <- c("blue", "green", "yellow", "red")
custom_lwd <- 2
# Plot trajectories with custom colors and line width
plot3 <- plot_velocity(MountTom, V_mounttom,
param = "V", lwd = custom_lwd,
colours = custom_colours
)
print(plot3)
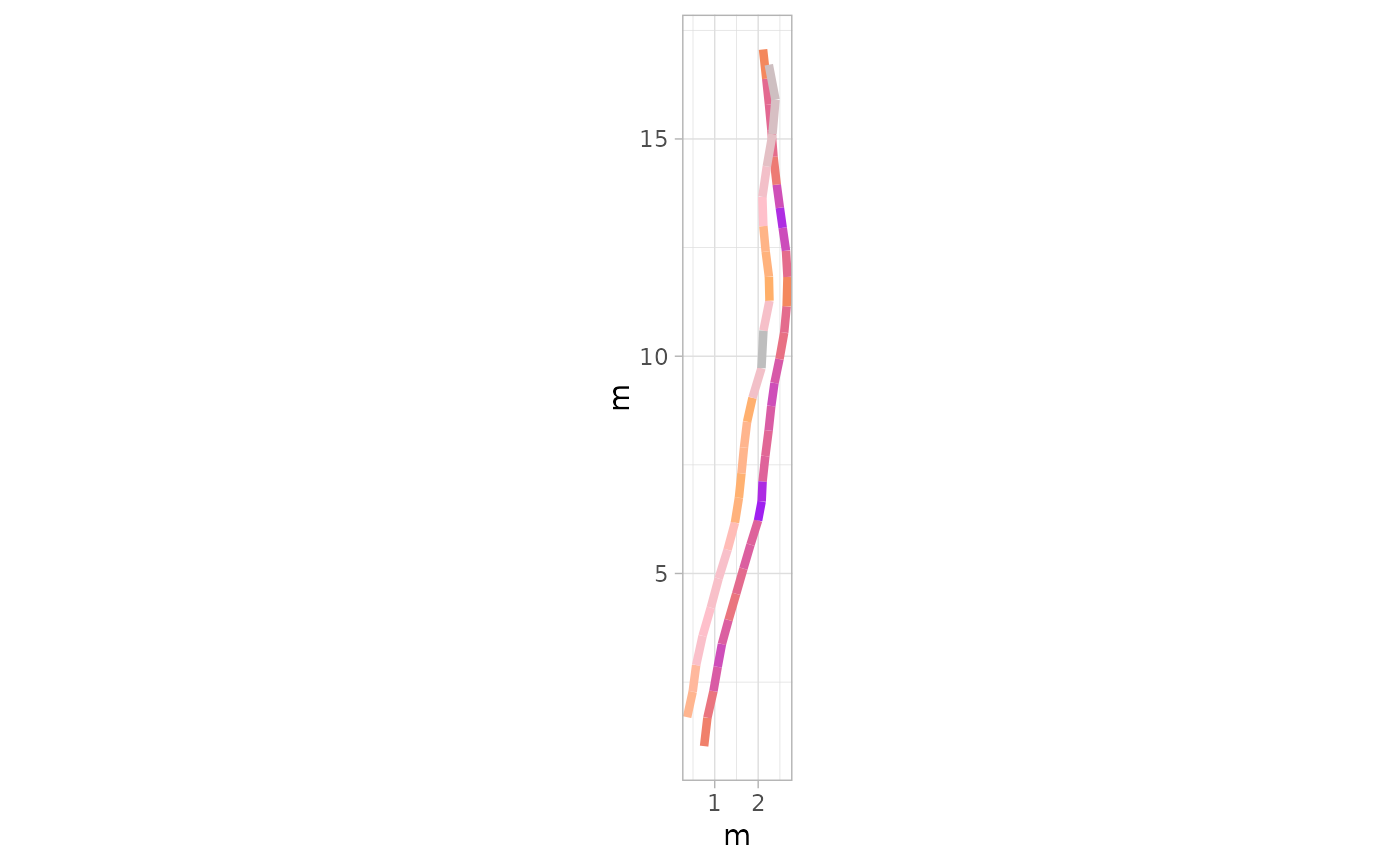
 # Example 4: Plot Trajectories Colored by Relative Stride Length with Custom Line Width
# and No Legend (PaluxyRiver dataset)
# Custom colors and line width
custom_colours_rsl <- c("purple", "orange", "pink", "gray")
custom_lwd_rsl <- 1.5
# Plot trajectories with custom colors, line width, and no legend
plot4 <- plot_velocity(PaluxyRiver, V_paluxyriver,
param = "RSL", lwd = custom_lwd_rsl,
colours = custom_colours_rsl, legend = FALSE
)
print(plot4)
# Example 4: Plot Trajectories Colored by Relative Stride Length with Custom Line Width
# and No Legend (PaluxyRiver dataset)
# Custom colors and line width
custom_colours_rsl <- c("purple", "orange", "pink", "gray")
custom_lwd_rsl <- 1.5
# Plot trajectories with custom colors, line width, and no legend
plot4 <- plot_velocity(PaluxyRiver, V_paluxyriver,
param = "RSL", lwd = custom_lwd_rsl,
colours = custom_colours_rsl, legend = FALSE
)
print(plot4)
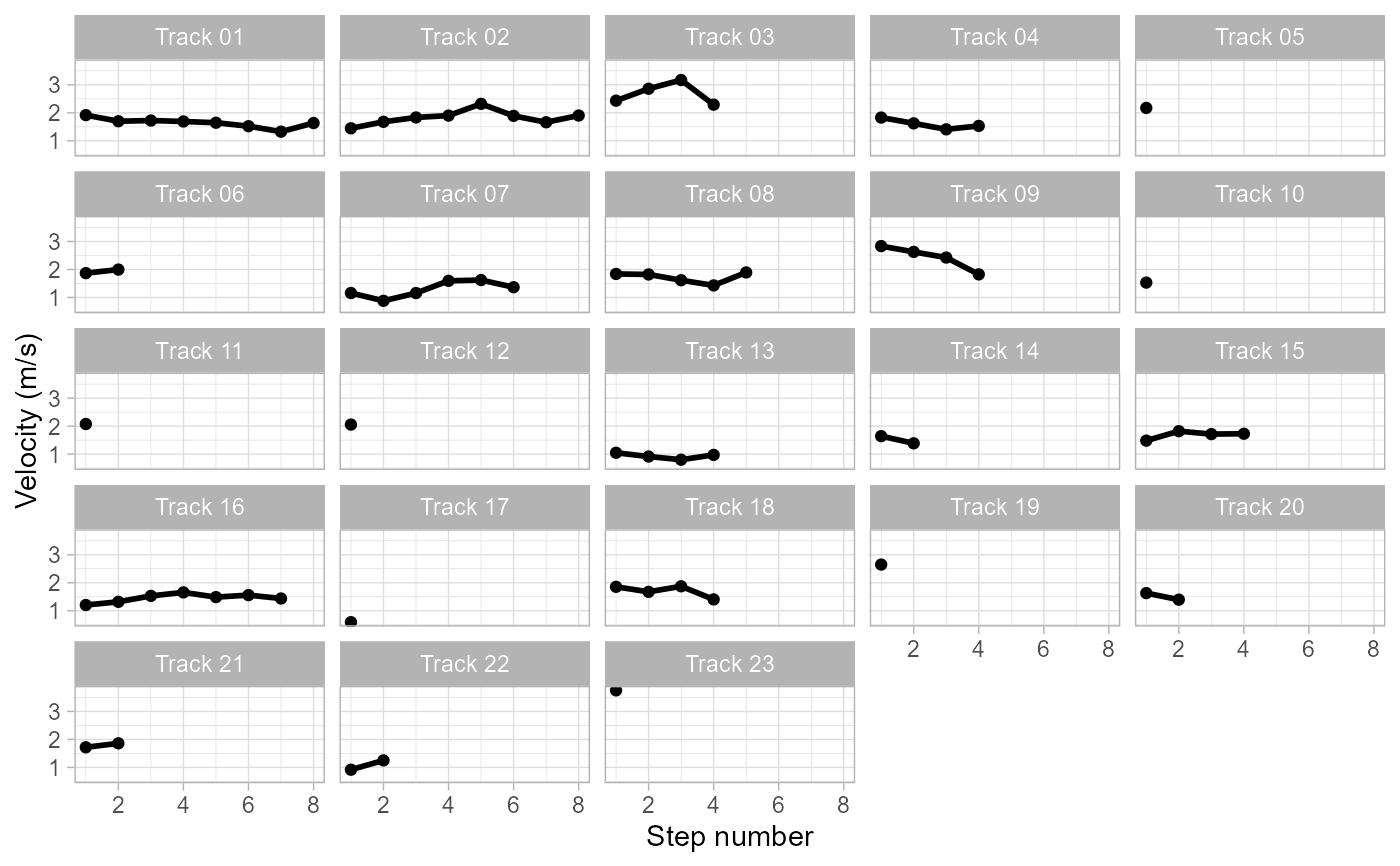
 # Example 5: Plot Step-Sequence Velocity Profiles (MountTom dataset)
# Plot velocity along step sequence for each trackway
plot5 <- plot_velocity(MountTom, V_mounttom, type = "sequence", param = "V")
print(plot5)
# Example 5: Plot Step-Sequence Velocity Profiles (MountTom dataset)
# Plot velocity along step sequence for each trackway
plot5 <- plot_velocity(MountTom, V_mounttom, type = "sequence", param = "V")
print(plot5)
 # Example 6: Plot Step-Sequence Relative Stride Length Profiles (MountTom dataset)
# Plot relative stride length along step sequence for each trackway
plot6 <- plot_velocity(MountTom, V_mounttom, type = "sequence", param = "RSL")
print(plot6)
# Example 6: Plot Step-Sequence Relative Stride Length Profiles (MountTom dataset)
# Plot relative stride length along step sequence for each trackway
plot6 <- plot_velocity(MountTom, V_mounttom, type = "sequence", param = "RSL")
print(plot6)